Reporting
The Intervals Gantt Chart

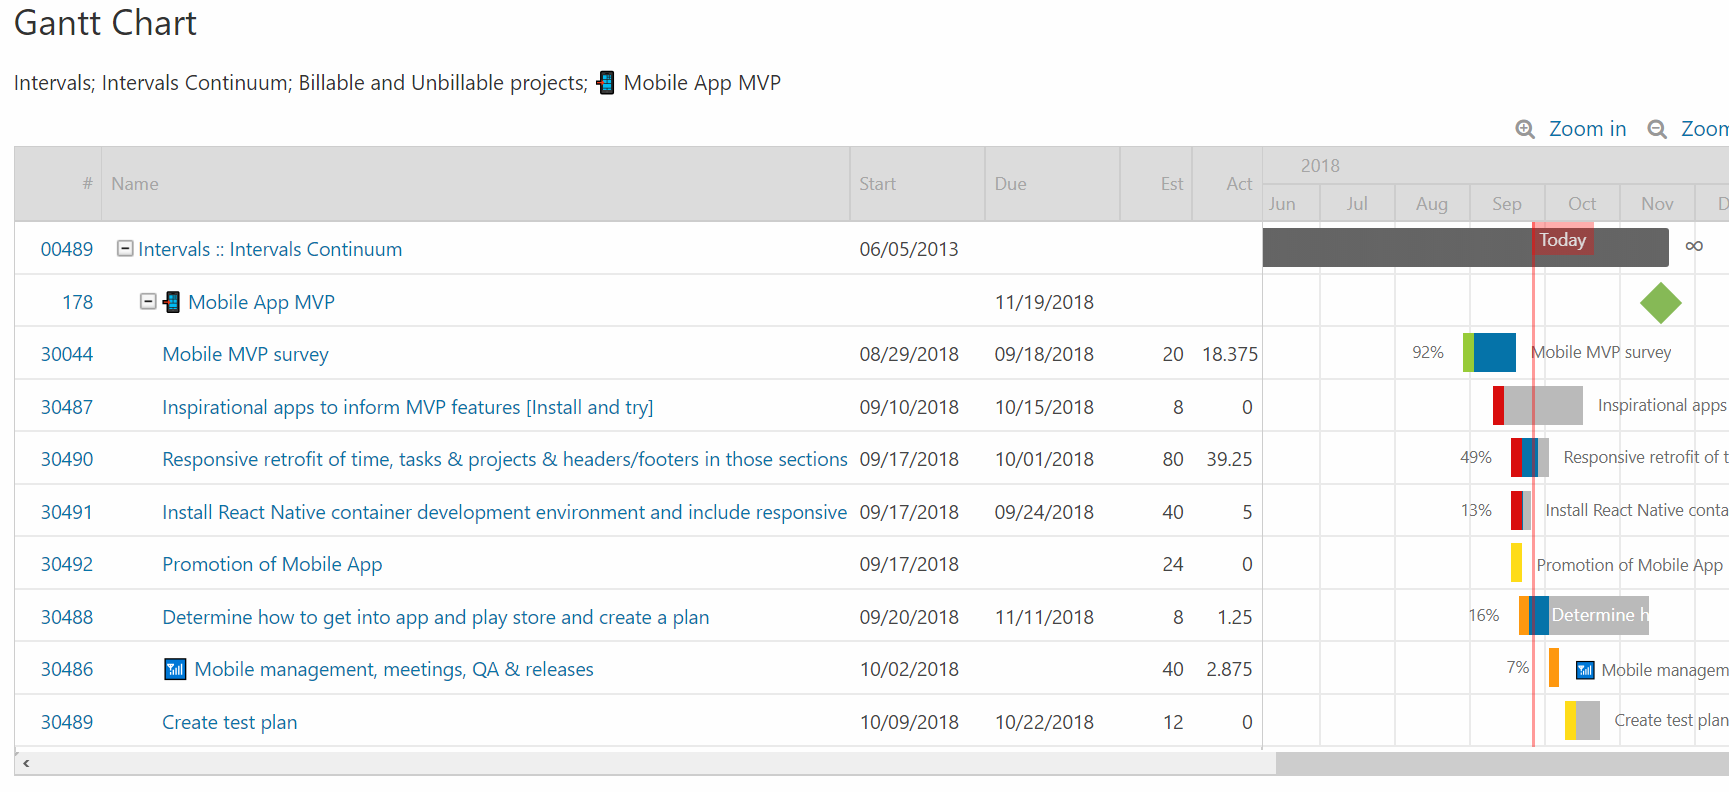
More than just a Gantt chart. The traditional and popular Gantt chart has been layered on top of our powerful time tracking and task management software. If you are looking for a simple Gantt chart building tool you are in the wrong place. If you are looking to view, edit and interact with Gantt charts within the same software where you manage your work and track your time, you are in the right place.
The Gantt chart within Intervals is just one of the ways in which you can view and interact with your project data. Get your workflow optimized and delivery better quality through better processes while eliminating wasted time on unimportant tasks.
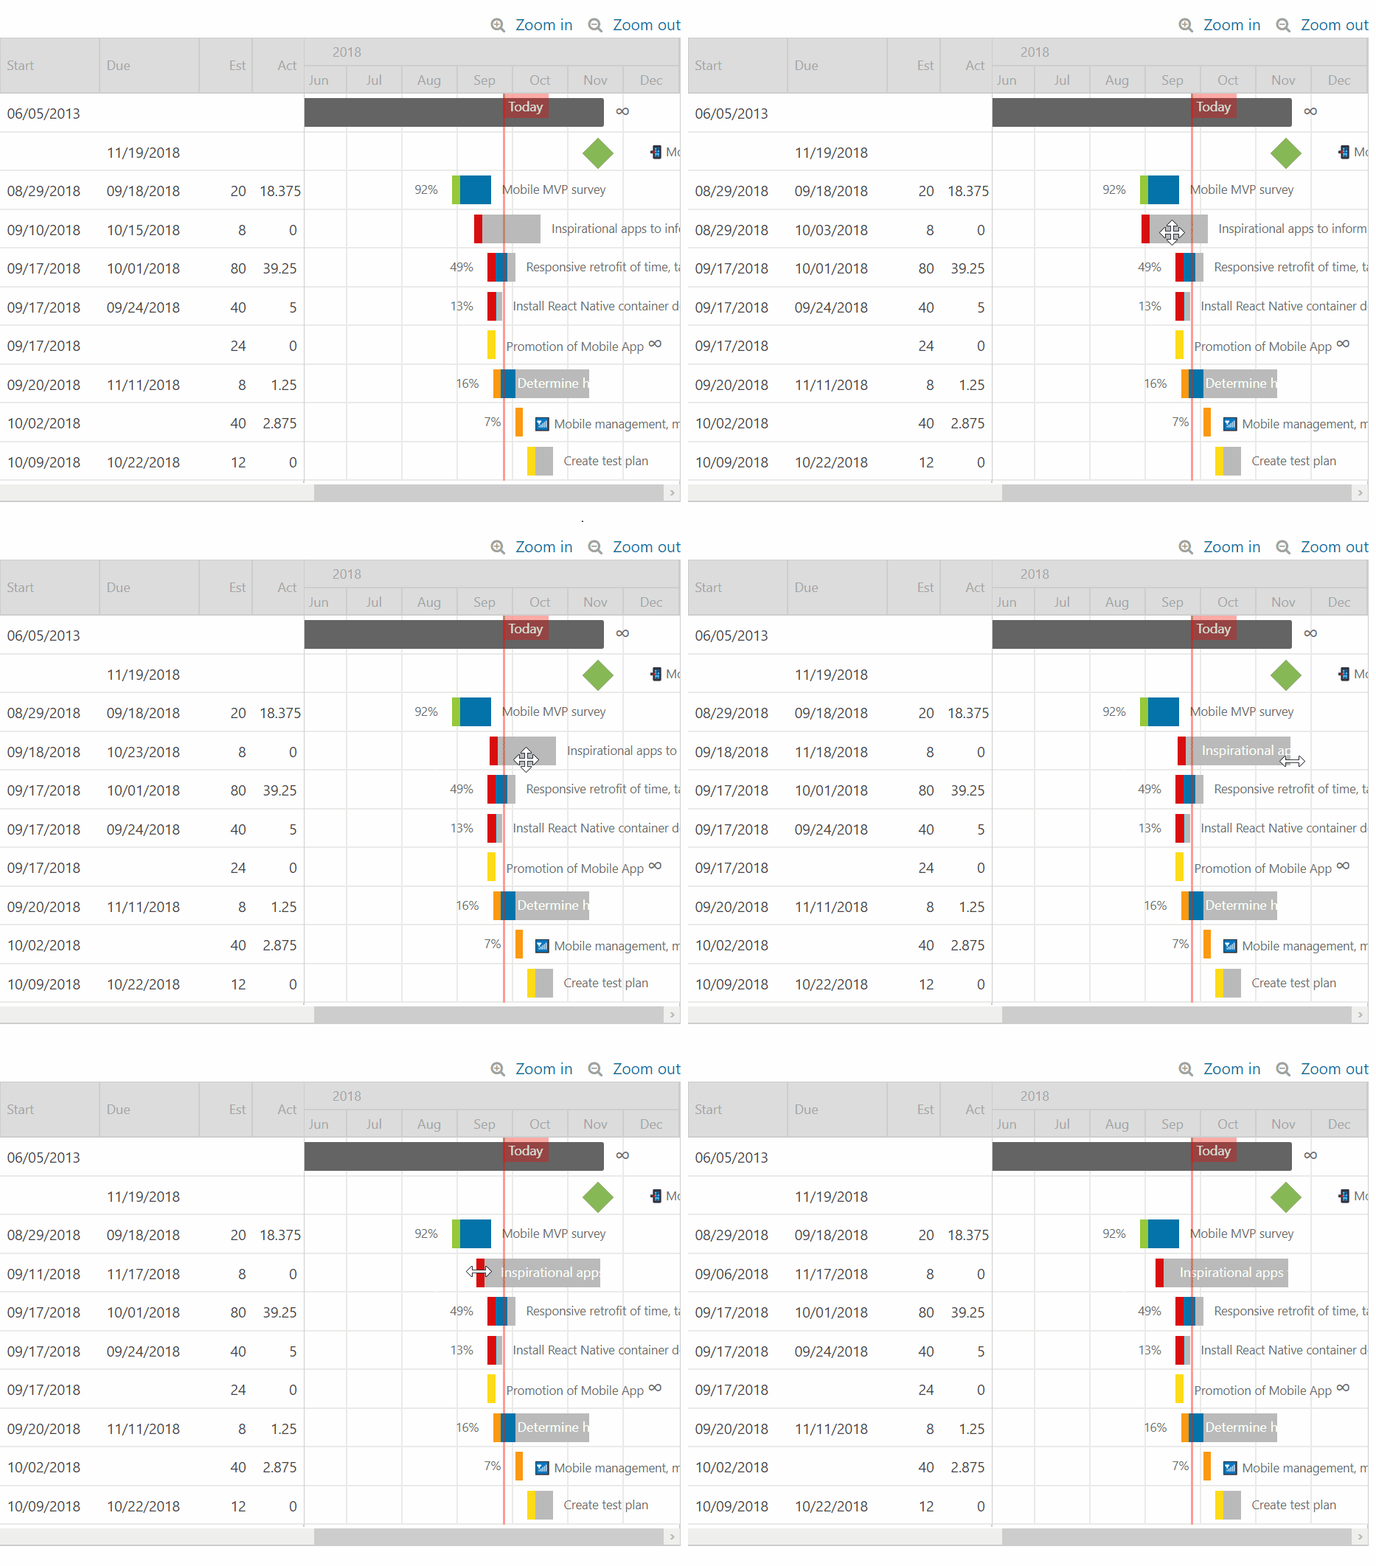
Use the Gantt chart to see how much work is currently scheduled across your team, and how much work is coming down the pipeline, and plan your next project accordingly. Drag to reschedule tasks and milestones. Create the project plan that works for you and easily communicate with your team and clients.
Like all Intervals reports, the filter options give you a powerful way to drill down deeper. For example, run the report on one of your team members to see how their schedule is directly impacted by your current workload.

The above animation illustrates how to drag and drop tasks when rescheduling them or changing duration.
If you are in search of better organization for your business and team we invite you to try Intervals for free with no obligation. In very little time you can run a project through Intervals and learn more about your processes and where your time is really going. If you have any questions along the way our friendly support team is always here to help.
Gantt Chart Highlights
Visualize and interact with your project and tasks data in the same place you manage your work and track your time. No need for an additional tool and another login to get your work done. Quickly and easily show project status and reorganize tasks to better fit your desired workflow.
- Visualize your tasks and workflow
- Drag and reschedule your work
- See a hierarchy of all your tasks
- See actual time on your tasks
- Export and share in PDF or image format
- Save your favorite filters for one click reporting

